


10 Essential Fiscal Charts Demonstrating America's Disastrous Condition
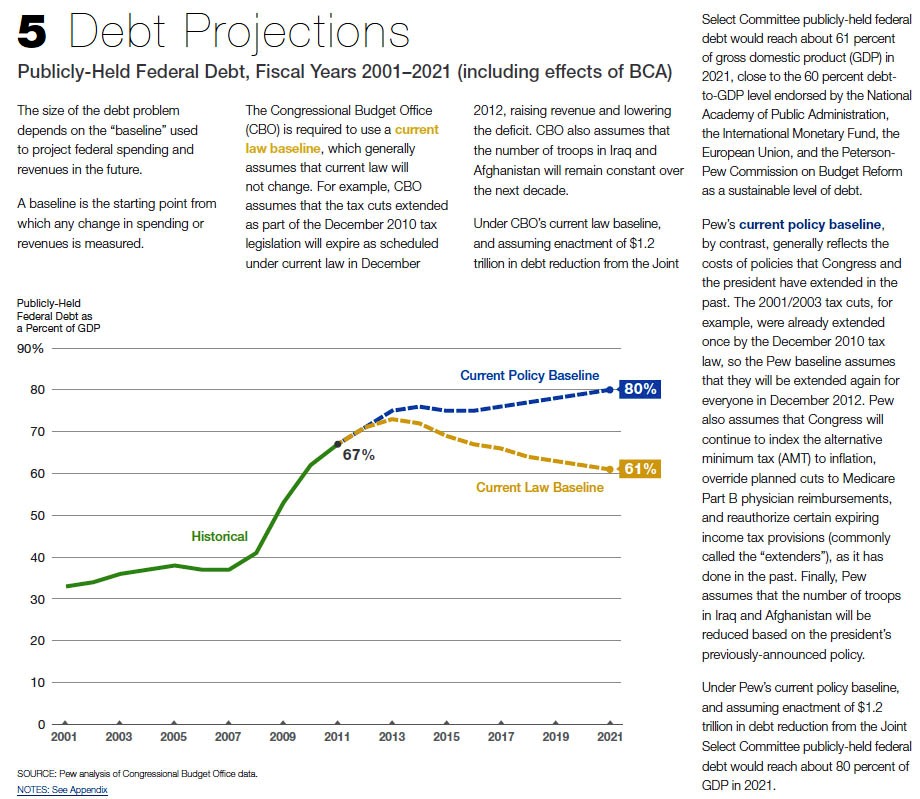
By now nobody should have any doubts as to just how disturbing America's fiscal debacle is. For those naive and innocent few who still think there is a Hollywood ending with a pot of gold awaiting everyone at the end of the rainbow, we present the following "10 essential fiscal charts" from the Pew Policy Institute. To be sure, these are all charts summarizing data that has appeared on Zero Hedge repeatedly over the years in some way shape or form. Pew does, however, have a flair for dramatic visual presentation. In Pew's own words: "Since April 2010, the Pew Fiscal Analysis Initiative has published several reports explaining the medium-and long-term fiscal challenges facing the federal government. With stagnating economic conditions and the passage of new legislation, especially the Budget Control Act of 2011, the outlook for the deficit and debt has changed considerably over the past six months. We have created 10 charts that illustrate how the choices made over the last 10 years contributed to our nation's debt and the challenges currently facing the Joint Select Committee on Deficit Reduction." So without further ado...
--
Thanks,
Happy Investing.
BLOGS : http://investbourses.blogspot.com , http://investbourses.wordpress.com,
Twitter : Investbourses, Facebook : Inv Bou
Note- Members express their own view & may be or may not be having investment or speculative positions in the commodity, please do not take it as buy or sell advise, please use your own judgments for buying or selling, after having discussion with your certified investment brokers or the person to whom u have good level of confidence. once sentiment is changed from good to bad no good news work but bad news do work, investors must keep this in mind.NEW INVESTORS SHOULD BE VERY CAREFUL.
No comments:
Post a Comment