Tuesday 25 August 2009

Can you buy gold today and then walk away?

GOLD ANALYSIS

Can you buy gold today and then walk away?

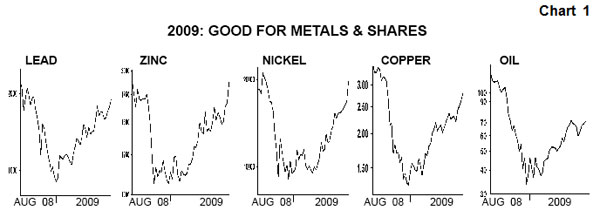
Gold has tracked its seasonal pattern very closely this year, and indications are it reached a low during July. Traditionally, August is an excellent time to buy gold.

Author: David Levenstein
Posted:  Monday , 24 Aug 2009

JOHANNESBURG - 

Gold began the last week with considerable downside pressure as bearish news filtered through the markets. There was a massive short position from the bullion banks, JP Morgan and HSBC and a report from the World Gold Council. According to the report gold demand fell to a six-year low in the second quarter as recession curbed buying by jewelers and electronics producers. The report also stated that global consumption fell 8.6% to 719.5 metric tons from a year earlier. That's the lowest level since the first quarter of 2003. Jewellery demand declined 22% and electronics, the biggest industrial use for gold, slid 26%.  Rozanna Wozniak, investment research manager at the council said, "Tough economic conditions have impacted jewellery and industrial demand. Investment demand provided a cushion and we do expect that to continue."

In India, the largest buyer, gold demand fell 38% to 109 tons, while it rose 11% in China, the second-biggest buyer, to 89.6 tons, the World Gold Council said. Germany was the biggest investment market with demand of 28 tons, compared with 23 tons in the U.S. and 21 tons in India, the report said.

Gold is, however, turning out to be a major investment avenue for Indian investors. Despite high local prices, dollar volatility and fall in general demand for jewellery, retail investment demand for gold has seen a sharp upswing.

Retail investment demand in India returned to positive levels after seeing slack demand in the first quarter, but was nevertheless weak in comparison to the year-earlier totals. The demand for bars and coins was 21.0 tons compared to 48.1 tons recorded in Q2′08. Experts said despite the recent near record rupee prices, investor appetite and consumer affinity for gold remains healthy.

China's gold market exhibited a "unique resilience" according to the World Gold Council in the face of the pressures of the global economic recession. Mainland China's jewellery demand rose 6% year on year in the second quarter, the only major jewellery buying nation to record a positive rate of growth in volume, while investment demand remained relatively stable. Rozanna Wozniak, the WGC's investment research manager said, "China's cultural affinity to gold may not be quite as strong as it is in India, but gold ownership is nevertheless a key part of the wedding season, gifting season and process of wealth protection and accumulation," said Ms Wozniak.

The WGC said China could overtake India as the world's largest gold consumer within the next 10 years, or even as early as within the next five years. Gold only accounts for 2% of the total reserves held by China's central bank. If China's reserves continue to grow rapidly, more gold would be required just to maintain a constant proportion. It is no secret that China is the largest holder of US government bonds and more than once, they have expressed their concern about the value of the dollar. I believe that China will continue to diversify some of its reserves into gold.

While there are no guarantees that seasonal patterns recur every year, gold has tracked its seasonal pattern very closely this year, and I believe that it has made it's low during July. Traditionally, August is an excellent time to buy gold.

By the end of the week, we saw a drop in the value of the US dollar against the Euro, Nymex October oil jumped some US$7 from US$66 to US$74, and as to be expected gold shot upwards and at one point Dec gold touched $960.


Technicals 

Gold is forming a right-angled triangle with a resistance level at the US$960-US$965 level.  The seasonal lows during the July/August seem to have already occurred in July when it touched US$905 and I am now looking for a break above US$960 in the short-term.

 While I have never advocated switching your entire assets into gold or any other asset for that matter, gold is the ideal diversifier for a stock portfolio. Although the price of gold can be volatile in the short-term, gold has maintained its value over the long-term, serving as a hedge against the erosion of the purchasing power of paper money. Gold is an important part of a diversified investment portfolio because its price increases in response to events that erode the value of traditional paper investments like stocks and bonds.  

--
Thanks,
Commodity Daily

You received this message because you are subscribed to the Google Groups "Commodity Daily" group.
To subscribe visit link http://groups.google.com/group/commoditydaily/subscribe  
To unsubscribe from this group, send email to commoditydaily-unsubscribe@googlegroups.com

http://commoditydaily.i8.com and http://commoditydaily.blogspot.com
 
Note- Members express their own view  & may be or may not be having investment or speculative positions in the commodity, please do not take it as buy or sell call, pl use  own judgments for buying or selling, after having discussion with your certified investment brokers or the person to whom u  have good level of confidence. once sentiment is changed from good to bad no good news work but bad news do work, investors must keep this in mind.
NEW INVESTORS SHOULD BE VERY CAREFUL.

Thursday 20 August 2009

Commodity Daily's GIFT to members on Birthday !!

Dear Members,

Commodity Daily launches new website http://commoditydaily.i8.com and Blog http://commoditydaily.blogspot.com for the members.

Now member can track following on the website:

Quotes / Charts : Equity, Commodity and Forex quotes and charts in single page (Nasdaq, Dow, NSE, BSE, Currencies, Metals - MCX and NCDEX coming soon)

Real time News : Live news from all over the world

Economy Calendar :  Economy Calendar for all major markets with prior release and forecast ( USA, JAPAN, UK, etc. )

Holiday Calendar : Holiday Calendar for Global markets 

Market Reports and Live calls : Track market reports from different sources and live calls on global markets ( find the link LIVE UPDATE on website)

Live Chat : Live chat strait from website

World Clock : World clock for different trading zone and timings

Inbuilt Search Engine : Search anything on global market and diver asset classes from within webpage

All in ONE PAGE, Isn't its great thing.

If you find it worth, please do support us by CLICKING on GOOGLE ADS on webpage and BLOG for continues development.

Happy Trading,
Commodity Daily

You received this message because you are subscribed to the Google Groups "Commodity Daily" group.
To subscribe visit link http://groups.google.com/group/commoditydaily/subscribe  
To unsubscribe from this group, send email to commoditydaily-unsubscribe@googlegroups.com

http://commoditydaily.i8.com and http://commoditydaily.blogspot.com

Note- Members express their own view  & may be or may not be having investment or speculative positions in the commodity, please do not take it as buy or sell call, pl use  own judgments for buying or selling, after having discussion with your certified investment brokers or the person to whom u  have good level of confidence. once sentiment is changed from good to bad no good news work but bad news do work, investors must keep this in mind.
NEW INVESTORS SHOULD BE VERY CAREFUL.

Wednesday 19 August 2009

The Commodity World is Growing in Strength

The Commodity World is Growing in Strength

Mary Anne & Pamela Aden
The Aden Sisters

The commodity market is bub bling. Whether it be sugar reaching a three year high, copper and other base metals reaching almost one year highs, or oil and gold rising further. The markets are looking good.

They're moving up on signs that the global recession is easing. This is boosting demand, especially in China and Asia, which is pushing prices up.

TANGIBLES ARE "IN"

Tangibles are growing in strength. From the metals, natural resources, energy and food, these markets are rebounding strongly and they're poised to continue rising in the years ahead. Demand is the driving force, making commodities a power ful market.

The Chinese are astute investors. They're buying up lots of hard assets and commodities for infrastructure, and they're using their dollar re serves to buy these goods.

The world is on sale and China is the main buyer. The Chinese have already been focusing on re source rich developing countries, and less on monetary investments. They're using their reserves to sup port and speed up overseas expan sion and acquisitions by Chinese companies.

This is a growing tendency, and it's not just China. Other countries are doing the same to lock in natu ral resources for the future.

China's economy is showing impressive strength, boost ing raw materials' consumption even more. Top Chinese officials have been commenting about this in recent weeks.

A research chief, for example, said China should buy gold and U.S. real estate instead of Treasur ies. Another top economic official said China should use more of its $2 trillion reserves to buy energy and natural resources. He also be lieves their 2% gold reserve is too small, even though China has al ready increased their gold reserves about 75% over the last five years.

COPPER: Almost one year high

With this kind of de mand, it's not surprising to see the base metals rising from major low areas with some like zinc, lead and nickel reaching 10 month highs. Plus, copper jumped up further this month, turning clearly bullish along the way (see Chart 1). The same is true of oil.

ASSET CLASSES STILL MOVING TO GETHER

The more it looks like the financial crisis and global recession is over, the more this pushes up commodities, stocks and currencies. They are all rising for the same reason, which is understandable, but keep in mind that this is not normal.

Commodities and the stock market don't usually move together and at some point they will go their separate ways. When this will happen and what will trigger it remains to be seen but it's something we have to keep a close eye on. Most important is to understand why each market is rising in the first place.

For commodities, its demand together with a weak dollar which is very bullish. For stocks, it's op timism for a better economy, but inflation would eventually kill the rise. For currencies, it's the weak dollar, and also the commodity rise for the commodity currencies. For bonds, it's the financial health of the global economy and inflation.

The world is slowly moving to wards tangibles and away from financials. The ongoing commodity bull market is eight years old and considering that commodity bull markets over the past 100 years have lasted on average 17 years, the current bull-run could go on for another decade. And the long-term leading indicators for oil, copper and the base metals are all reinforcing this.

GOLD: THE SPECIAL ONE

As for gold, its main purpose is money. Gold is the ultimate cur rency, it's a safe haven and it thrives during economic uncertainty. Gold and commodities tend to move together in a general wave but it will outperform or underperform the other metals and commodities at times.

China is on the mend and its plans to add more gold to its re serves is very bullish for gold. China could easily overtake India in gold consumption this year, especially since it's the first nation to rebound from the global recession. China's GDP recently rose to 7.9% as the massive stimulus plan and record bank lending began to take effect.

Gold's big picture is bullish as you can see on Chart 2. The mega trend is up and the bull market rise since 2001 is turning 8½ years old this month. This is im portant because the eight year mark has been a key low point for gold going back to the 1960s when gold began trading in the free market.

THE TIME FOR TRUTH

Chart 2 shows that this pattern has repeated four times since 1969 and the fifth low is now on the longer side of the normal time span. This low period can vary from 7 to 8½ years, fol­lowing the previous low, which means that, if gold stays above last November's low, then that $705 low was the low for this time around. This would make it a 7 year 10 month low fol lowing the previous February 2001 low… just three months shy of the 8 year mark. We'd say that's pretty close.

So if the 8 year pattern re peats, and we believe it will, then current prices are still at good levels for buying new positions. We should have all of our positions bought this month because come the Fall, we could really see gold take off.

TIMING GOLD

Chart 3 shows a closer look at gold's intermediate moves and as you can see, gold has been forming a springboard for upcoming higher prices. As our subscribers know, gold moves in an A-D pattern on an intermedi ate basis. D declines tend to be the worst decline and gold reached the last D low in November.

It then rose from those lows in a moderate rise we call "A" which peaked last February. This is when the springboard began as gold de clined from that high to form a mod erate "B" low last April at $868.

Since then, a C rise has begun. It's been quietly forming a coil and gold looks ready to take off. Gold's been rising this past month and it's strong above $935. It reached a nine week high and it would be very strong above $985. A super strong C rise would be underway above $1004, the record high.

Keep in mind, C rises tend to be the best rise in the pattern. By hitting a new record high, gold would confirm that the bull mar ket is entering an even stronger phase and it could then rise to near $1200. It would also confirm that the 8 year low indeed happened last November.

Since November, gold's been posting higher lows which is also positive action. For now, if gold stays clearly above the July 8 low at $909, it'll be reinforcing its strong uptrend since November and all systems will continue to be go!


--
Thanks,
Commodity Daily

You received this message because you are subscribed to the Google Groups "Commodity Daily" group.
To subscribe visit link http://groups.google.com/group/commoditydaily/subscribe  
To unsubscribe from this group, send email to commoditydaily-unsubscribe@googlegroups.com

OnlineChat : "commoditydaily@gmail.com" , http://commoditydaily.blogspot.com
Note- Members express their own view  & may be or may not be having investment or speculative positions in the commodity, please do not take it as buy or sell call, pl use  own judgments for buying or selling, after having discussion with your certified investment brokers or the person to whom u  have good level of confidence. once sentiment is changed from good to bad no good news work but bad news do work, investors must keep this in mind.
NEW INVESTORS SHOULD BE VERY CAREFUL.

The Gold/Silver Ratio

The Gold/Silver Ratio


The Gold/Silver Ratio
August 14, 2009

The following is an interview I did recently discussing the gold/silver ratio. This topic seems to surface from time to time and Tom Jeffries and I explored it together.

Tom Jeffries:  David Morgan is one of the world's foremost experts on silver.  I would like you to check in with David's excellent Web site, silver-investor.com.  That's where you can check out David's monthly investment newsletter, The Morgan Report (full disclosure: I read it every month myself).  And there is a ton of excellent resources for the investor of all stripes.

You talk many times in your lectures, and you've talked in The Morgan Report recently, about something called the gold/silver ratio and where it's going.  Can you talk a little bit about that?

David Morgan:  It is a controversial subject.  There are a lot of people who don't put any credence into it at all, there are some people who put a whole lot of credence into it, and then there are people, like me, who absolutely put some credence into the ratio.

The basics of it are this—and I like to go for the long-term version, so—starting at the 12thcentury or so and going to present time, if you looked at every one foot in length being 100 years (or one century), you would see throughout the entire timeframe that you would have several feet in length and it would only be in the last 19 inches of that chart where the ratio got above 16 to 1.  (Note: a discussion of this is done by Franklin Sanders in his book Silver Bonanza.)

In fact, the ratio from the 12th century to roughly the 17th century was about 12 to 1, which is what I call the "natural ratio" at that time, and I define the natural ratio as the amount of silver to gold in the earth's surface.  Right now it's less than 12 to 1, having dropped down to about 8 to 1, which means that there's about eight ounces of silver in the earth's surface for every ounce of gold.

So that's the natural ratio, and that ratio held for hundreds and hundreds of years with the free market making the determination—amazing!  Then, Sir Isaac Newton monetized it at a ratio of 15.5 to 1 after England was having a terrible time with their fiat money system.  Newton came in and put them on a gold standard and then, with his brilliance, he picked a number basically based on the marketplace (at that time), which determined that the correct ratio of silver to gold was 15½ ounces of silver to 1 ounce of gold.

And that's what we called the monetary of the classic ratio, and that held roughly from the 17th century for hundreds of years through about the 1873 timeframe.  Then there was The Crime of 1873, which we don't have time to go into, but that was roughly where silver was demonetized in the United States, and after that, you've seen the ratio undergo some really wide swings. 

It's gone up as far as 100 to 1 a couple of times, and we've seen it just kiss the classic ratio of 16 to 1 for a day. In modern times, meaning during the last big run-up in January of 1980, it got back to classic ratio, but again, it was only for a day or two at the most.  And then the ratio dropped off.

So having given you all that background, what does it mean?  For some it means you can trade the ratio, which is something that I do personally.  Secondly it's a good indicator for the overall direction of the market as far as I'm concerned.  When silver's leading gold, we've got more momentum in the metals than when it's not, and silver has basically outperformed gold since 2003 until recently.  In other words, in the ratio from 2003, the bottom of the silver market, and when gold was at $252 in 2000, silver went from the 80 to 1 ratio down to about 55. Currently it is around the 65 to 1 level.

And it was working its way even lower when we had this credit crisis surface, which didn't surprise me.  We got a big spike on the ratio and actually it got to around 90 to 1—again, very temporarily, maybe for a day or two.

I think it shows that silver is still undervalued to gold, but I'm open-minded enough to think that maybe something else is going on.  In an absolute all-out deflation, which would be the better—gold or silver?  The preponderance of evidence is that gold does better.  I wrote a paper on this; it was in The Morgan Report, and I also did a couple of speeches on this subject.  The record is mixed as far as how silver does in a deflation.

Gold is pretty much known to do well in deflations, and this is all history.  And because it is history, it doesn't absolutely guarantee you that the next time around gold will do great in a deflation, but it certainly implies that it will.

As far as silver is concerned, there have been times that silver did better than gold in a deflation, and many times where it did not.  But overall it's done fairly well and it held its purchasing power, so even in a deflationary scenario I wouldn't give up on silver.  But as far as what will it do, if we look at it today we would say gold has actually done better than silver here in the last several months, because the ratio has gone from the 55 to 1 back to around the current 65 level.

Regardless, the overall perspective would be, how is silver doing against all other financial assets, including gold?  And the answer to that is, essentially, gold has done best against all other financial assets, the general equities, the mining stocks, housing sector, bonds; and silver has done better than the base metals and most other sectors.

Silver is partly industrial and partly monetary and you can argue all day if it's both or not.  I'm absolutely convinced that it's both.  I've never argued that silver is just money.  I have argued very strongly that silver is money but it's not only money; it's certainly an industrial metal as well.

In summary, if [our readers] think—as I do—that the main problem ahead is a currency crisis with the U.S. dollar, then I would urge you to study what silver did during the last period (most recent) during a prelude to a currency crisis.  Basically, it outshone almost everything!  The problem is people are too shortsighted and look out only so far, not realizing that once everyone understands that the death of the dollar is imminent, there will be a mad rush for the precious metals both gold and silver!

Mr. Jeffries:  David, always a pleasure to have some time with you.  We really get a kick out of talking with you, but also I also commend you, too, for the learning.  We always have some great information.


--
Thanks,
Commodity Daily

You received this message because you are subscribed to the Google Groups "Commodity Daily" group.
To subscribe visit link http://groups.google.com/group/commoditydaily/subscribe  
To unsubscribe from this group, send email to commoditydaily-unsubscribe@googlegroups.com

OnlineChat : "commoditydaily@gmail.com" , "sgxdaily@gmail.com"
Note- Members express their own view  & may be or may not be having investment or speculative positions in the commodity, please do not take it as buy or sell call, pl use  own judgments for buying or selling, after having discussion with your certified investment brokers or the person to whom u  have good level of confidence. once sentiment is changed from good to bad no good news work but bad news do work, investors must keep this in mind.
NEW INVESTORS SHOULD BE VERY CAREFUL.

Global Liquidity

Commodiy Daily Blog

Global Liquidity


Same chart, except with the dollar index instead of gold


Annual percentage rate of change in the combination of a US money measure called the monetary base plus the total change rate of reserves of the main Central Banks of the world. 

It basically measures how fast the central banks are adding liquidity by measuring the growth rate of their own reserves at the IMF, then adding the monetary base to overweight the US. Source: IMF & Fed. Note also that the reserves data on which the charts are based do not include all Central Banks. China, for example, does not report data to the IMF. 


A note on this global liquidity chart:
We've had a few question the correlation lag between the two lines in both the late '70s and recently. They ask, if the correlation is supposed to be so good then why was there a 2+ year lag in both cases between the peak in liqudity and the peak in gold. Our answer is related to sentiment based on having wrong facts. Both in the late '70s and recently, most people are not aware or do not believe that inflation is running much higher than what their governments say. When they do start to truly believe that inflation is significant, gold and many other commodities will move much higher. 

Be very cautious about extrapolating that gold prices are due to fall greatly *and* on the longer term. We recommend that you notice that global liquidity peaked in 1977 and gold didn't peak until 1980, it's still expanding at over 10% even though the current trend is down, and also that there are strong indications that global liquidity is only temporarily dropping (see GDP and money creation above)(written and as of May 2006). 


Annual percentage rate of change obtained by adding the GDP growth rate of the G7 countries, adding the same growth rate percentage data from the global liquidity graph above this one, and then subtracting the average of the interst rates of the 10 year Treasury bond and the 10 year Euro bond. 

In other words, we're measuring the production rate of goods and services of the majority of the Western world, adding in excess money creation via the measurement of central banking reserves growth, and then subtracting an average interest rate to account for the cost of the money created and used. Source data is from the IMF, the ECB, & the Federal Reserve. 


--
Thanks,
Commodity Daily

You received this message because you are subscribed to the Google Groups "Commodity Daily" group.
To subscribe visit link http://groups.google.com/group/commoditydaily/subscribe  
To unsubscribe from this group, send email to commoditydaily-unsubscribe@googlegroups.com

OnlineChat : "commoditydaily@gmail.com" , "sgxdaily@gmail.com"
Note- Members express their own view  & may be or may not be having investment or speculative positions in the commodity, please do not take it as buy or sell call, pl use  own judgments for buying or selling, after having discussion with your certified investment brokers or the person to whom u  have good level of confidence. once sentiment is changed from good to bad no good news work but bad news do work, investors must keep this in mind.
NEW INVESTORS SHOULD BE VERY CAREFUL.

Indian Nifty update 19 Aug 2009 - PDF file

Dear Members,

Please find attached PDF file.

--
Thanks,
Commodity Daily

You received this message because you are subscribed to the Google Groups "Commodity Daily" group.
To subscribe visit link http://groups.google.com/group/commoditydaily/subscribe  
To unsubscribe from this group, send email to commoditydaily-unsubscribe@googlegroups.com

OnlineChat : "commoditydaily@gmail.com" , "sgxdaily@gmail.com"
Note- Members express their own view  & may be or may not be having investment or speculative positions in the commodity, please do not take it as buy or sell call, pl use  own judgments for buying or selling, after having discussion with your certified investment brokers or the person to whom u  have good level of confidence. once sentiment is changed from good to bad no good news work but bad news do work, investors must keep this in mind.
NEW INVESTORS SHOULD BE VERY CAREFUL.

Friday 14 August 2009

[Commodity Daily - A World of Possibilities] Global Market Trend update


 INDICES
Close
Change

3x1

7x5


 S&P 500 - Sep ESU9
1013.50
+ 11.25
1001.61
1003.75
Bullish
 Dow Jones - Sep YMU9
9388
+ 69
9295
9293
Bullish
 Nasdaq - Sep NQU9
1631.75
+ 13.00
1611.69
1615.25
Bullish
 Russell - Sep TFU9
575.50
+ 5.10
568.56
566.87
Bullish
INTEREST RATES
 US T-Bond - Sep USU9
118-06
+ 1-12
117-06
116-07
Bullish
 US T-Note - Sep TYU9
117-01
+ 0-27
116-06
115-15
Bullish
CURRENCIES
 US Dollar Index - Sep DXU9
78.580
− 0.320
78.982
78.612
Bearish
 Australian Dollar - Sep ADU9
0.8407
+ 0.0097
0.8319
0.8369
Bullish
 British Pound - Sep BPU9
1.6587
+ 0.0104
1.6512
1.6792
Neutral
 Canadian Dollar - Sep CDU9
0.9202
+ 0.0024
0.9155
0.9284
Neutral
 EuroFX - Sep ECU9
1.4293
+ 0.0102
1.4200
1.4262
Bullish
 Japanese Yen - Sep JYU9
1.0480
+ 0.0064
1.0422
1.0362
Bullish
 Swiss Franc - Sep SFU9
0.9348
+ 0.0060
0.9285
0.9314
Bullish
LIVESTOCK
 Feeder Cattle - Sep FCU9
99.900
− 0.125
100.189
101.050
Bearish
 Live Cattle - Oct LCV9
88.200
− 0.150
88.169
89.475
Neutral
 Lean Hogs - Oct LHV9
45.400
+ 1.425
44.736
47.833
Neutral
 Pork Bellies - Feb PBG0
79.150
− 0.250
79.347
80.458
Bearish
GRAINS
 Corn - Sep CU9
324^4
− 6^2
327^6
336^0
Bearish
 Wheat - Sep WU9
481^4
− 8^6
486^6
511^4
Bearish
 Soybeans - Sep SU9
1065^2
− 27^2
1085^2
1085^4
Bearish
 Soybean Meal - Sep SMU9
335.9
− 4.6
340.2
341.6
Bearish
 Soybean Oil - Sep BOU9
37.64
− 0.94
38.06
37.15
Neutral
ENERGY
 Crude Oil - Sep CLU9
70.96
+ 0.80
70.31
70.95
Bullish
 Heating Oil - Sep HOU9
1.9190
+ 0.0269
1.9100
1.9039
Bullish
 Natural Gas - Sep NGU9
3.358
− 0.121
3.510
3.811
Bearish
METALS
 Gold - Dec GCZ9
956.7
+ 4.2
951.3
962.3
Neutral
 Silver - Sep SIU9
15.005
+ 0.420
14.559
14.529
Bullish
 Copper - Sep HGU9
2.9215
+ 0.0980
2.8118
2.7495
Bullish
FOODS & FIBER
 Orange Juice - Sep OJU9
109.80
− 1.50
109.96
97.95
Neutral
 Sugar - Oct SBV9
22.21
− 0.76
22.30
20.12
Neutral
 Cocoa - Dec CCZ9
2932
+ 32
2892
2900
Bullish
 Coffee - Dec KCZ9
136.05
− 2.65
138.38
137.55
Bearish
 Cotton - Dec CTZ9
64.09
+ 0.21
63.93
61.97
Bullish


--
Thanks,
Commodity Daily

You received this message because you are subscribed to the Google Groups "Commodity Daily" group.
To subscribe visit link http://groups.google.com/group/commoditydaily/subscribe  
To unsubscribe from this group, send email to commoditydaily-unsubscribe@googlegroups.com

OnlineChat : "commoditydaily@gmail.com" , "sgxdaily@gmail.com"
Note- Members express their own view  & may be or may not be having investment or speculative positions in the commodity, please do not take it as buy or sell call, pl use  own judgments for buying or selling, after having discussion with your certified investment brokers or the person to whom u  have good level of confidence. once sentiment is changed from good to bad no good news work but bad news do work, investors must keep this in mind.
NEW INVESTORS SHOULD BE VERY CAREFUL.


--
Posted By Commodity Daily to Commodity Daily - A World of Possibilities at 8/14/2009 10:15:00 PM


--
Thanks,
Commodity Daily

You received this message because you are subscribed to the Google Groups "Commodity Daily" group.
To subscribe visit link http://groups.google.com/group/commoditydaily/subscribe  
To unsubscribe from this group, send email to commoditydaily-unsubscribe@googlegroups.com

OnlineChat : "commoditydaily@gmail.com" , "sgxdaily@gmail.com"
Note- Members express their own view  & may be or may not be having investment or speculative positions in the commodity, please do not take it as buy or sell call, pl use  own judgments for buying or selling, after having discussion with your certified investment brokers or the person to whom u  have good level of confidence. once sentiment is changed from good to bad no good news work but bad news do work, investors must keep this in mind.
NEW INVESTORS SHOULD BE VERY CAREFUL.