Commodiy Daily Blog
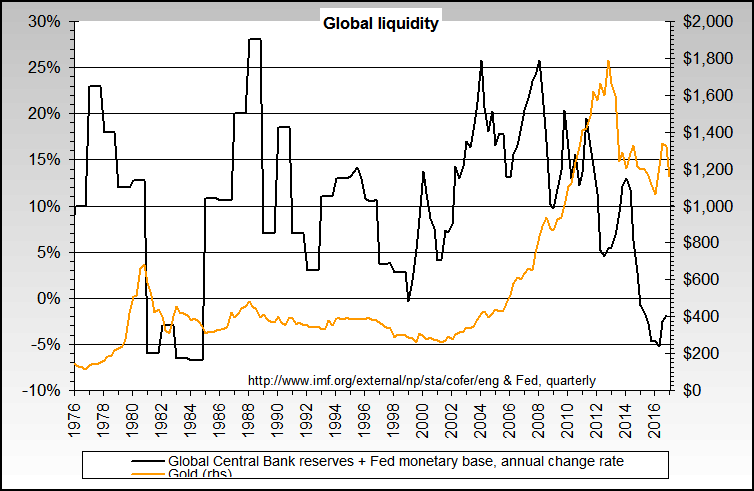
Global Liquidity
Same chart, except with the dollar index instead of gold
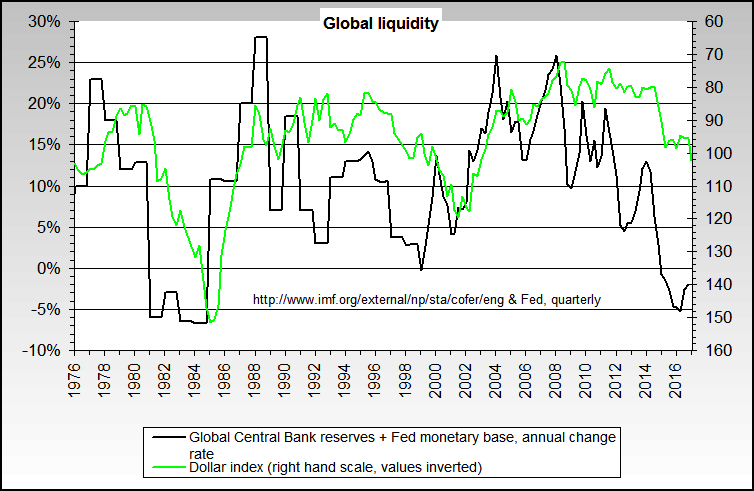
Annual percentage rate of change in the combination of a US money measure called the monetary base plus the total change rate of reserves of the main Central Banks of the world.
It basically measures how fast the central banks are adding liquidity by measuring the growth rate of their own reserves at the IMF, then adding the monetary base to overweight the US. Source: IMF & Fed. Note also that the reserves data on which the charts are based do not include all Central Banks. China, for example, does not report data to the IMF.
A note on this global liquidity chart:
We've had a few question the correlation lag between the two lines in both the late '70s and recently. They ask, if the correlation is supposed to be so good then why was there a 2+ year lag in both cases between the peak in liqudity and the peak in gold. Our answer is related to sentiment based on having wrong facts. Both in the late '70s and recently, most people are not aware or do not believe that inflation is running much higher than what their governments say. When they do start to truly believe that inflation is significant, gold and many other commodities will move much higher.
Be very cautious about extrapolating that gold prices are due to fall greatly *and* on the longer term. We recommend that you notice that global liquidity peaked in 1977 and gold didn't peak until 1980, it's still expanding at over 10% even though the current trend is down, and also that there are strong indications that global liquidity is only temporarily dropping (see GDP and money creation above)(written and as of May 2006).
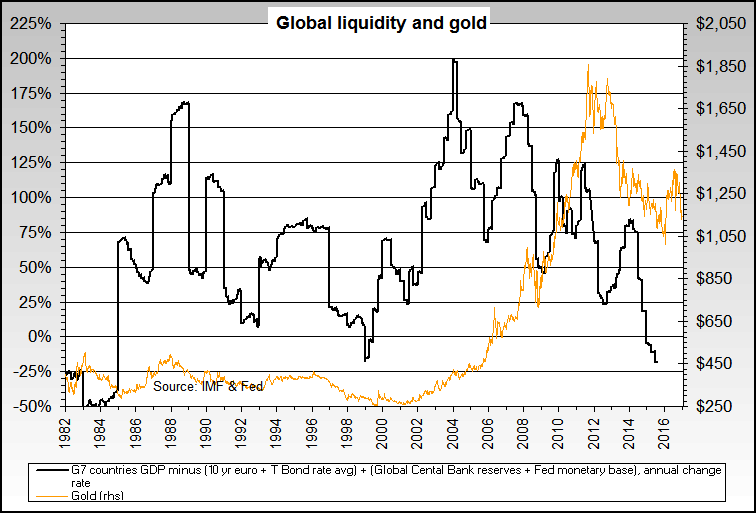
Annual percentage rate of change obtained by adding the GDP growth rate of the G7 countries, adding the same growth rate percentage data from the global liquidity graph above this one, and then subtracting the average of the interst rates of the 10 year Treasury bond and the 10 year Euro bond.
In other words, we're measuring the production rate of goods and services of the majority of the Western world, adding in excess money creation via the measurement of central banking reserves growth, and then subtracting an average interest rate to account for the cost of the money created and used. Source data is from the IMF, the ECB, & the Federal Reserve.
--
Thanks,
Commodity Daily
You received this message because you are subscribed to the Google Groups "Commodity Daily" group.
To subscribe visit link http://groups.google.com/group/commoditydaily/subscribe
To unsubscribe from this group, send email to commoditydaily-unsubscribe@googlegroups.com
OnlineChat : "commoditydaily@gmail.com" , "sgxdaily@gmail.com"
Note- Members express their own view & may be or may not be having investment or speculative positions in the commodity, please do not take it as buy or sell call, pl use own judgments for buying or selling, after having discussion with your certified investment brokers or the person to whom u have good level of confidence. once sentiment is changed from good to bad no good news work but bad news do work, investors must keep this in mind.
NEW INVESTORS SHOULD BE VERY CAREFUL.
No comments:
Post a Comment