Gold Spot Daily – 12 March 2010
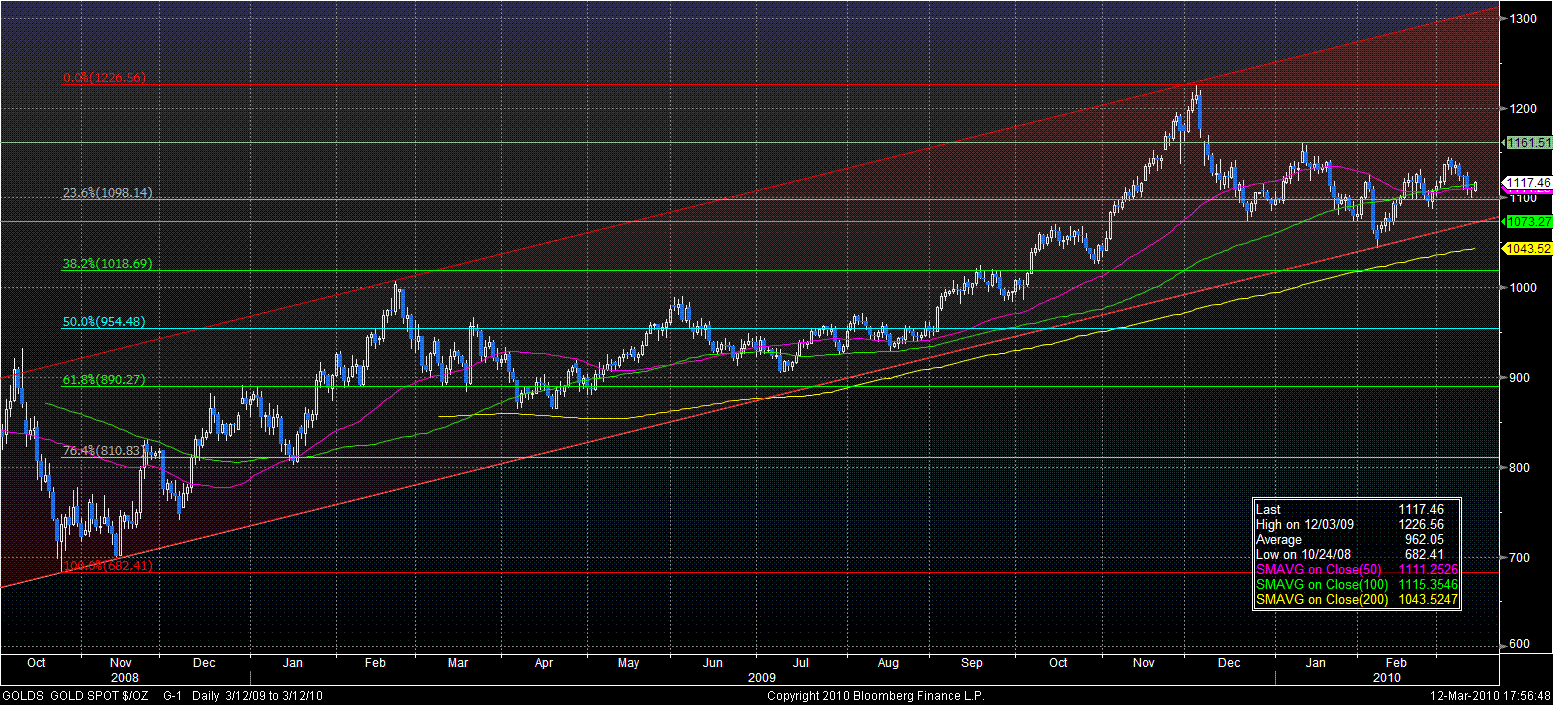
Gold has plunged about $20 this week twice from resistance range of $1145-$1150 on rising dollar and concern over Greek issue has been resolved. However, still gold managed to stay above $1100 level, which has not yet bruised the Daily support channel, closing below $1100 couple of times may take it to channel bottom @ $1073 for support.
Gold Apr10 Daily Chart
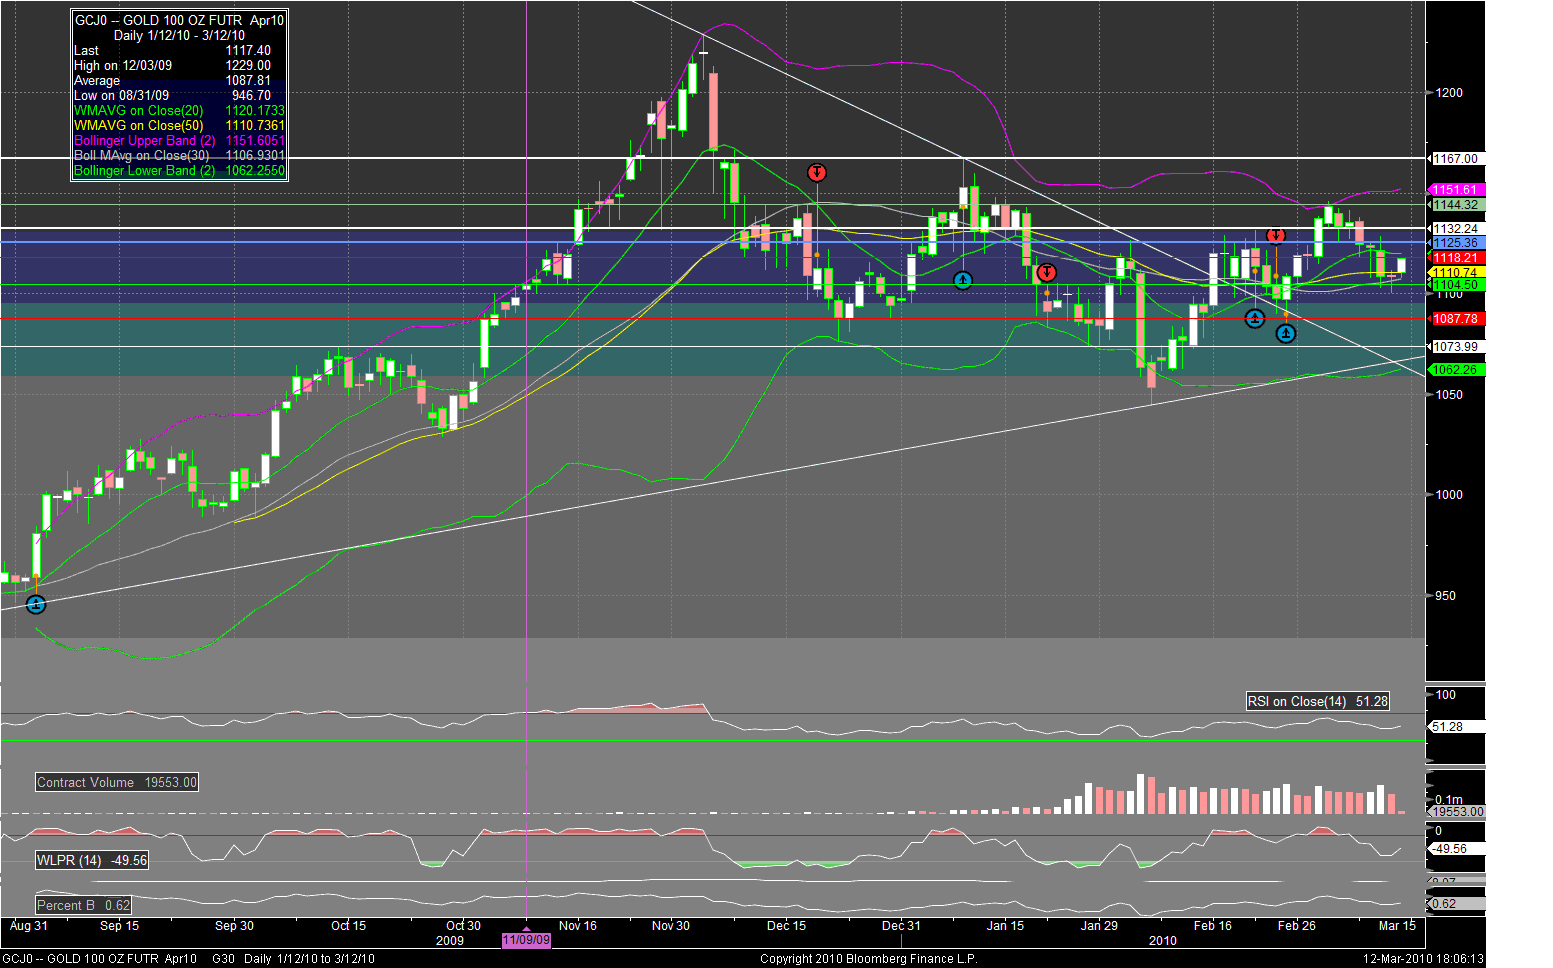
We can see a triangle break out above in the daily chart that support exists in the range of $1088-$1073. Only close below $1060 will be bearish.
Gold Apr10 Weekly Chart
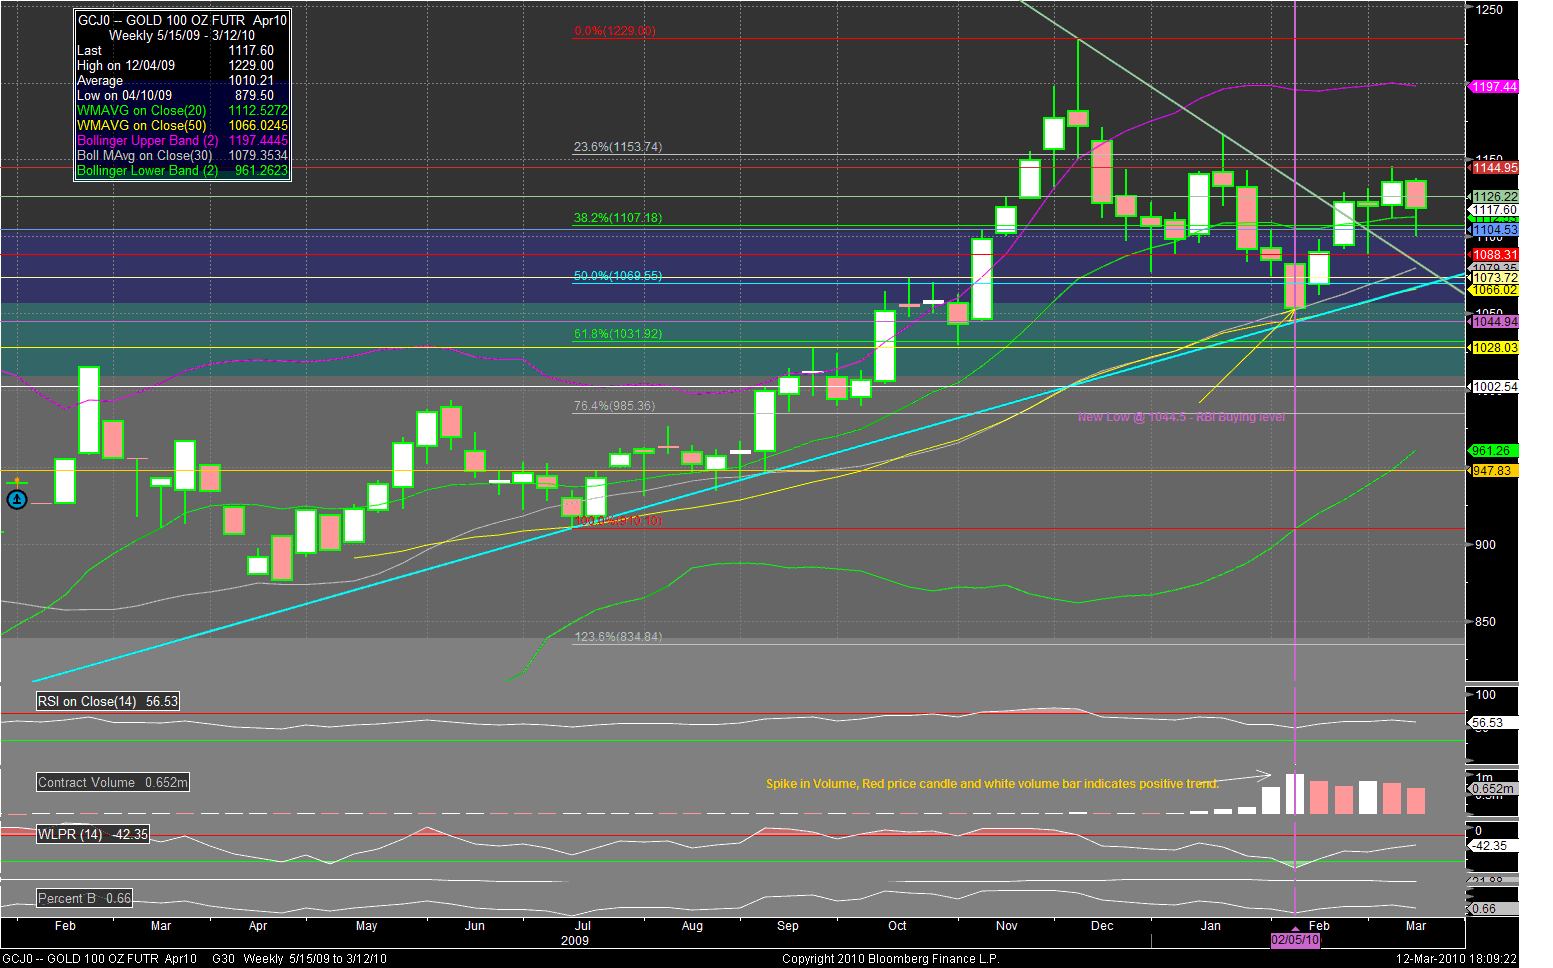
Gold fail to cross last week high @ $1145.8 and plunge to $1100 level but today's closing is important as its last day of the week. Bull still has an advantage if gold managed to close above $1120, which is closing for the month of Feb10. However, if gold fail to stay and close above $1120 and breaks below 1100 may take it to the support range of $1073-$1088.
Gold Apr10 Monthly Chart
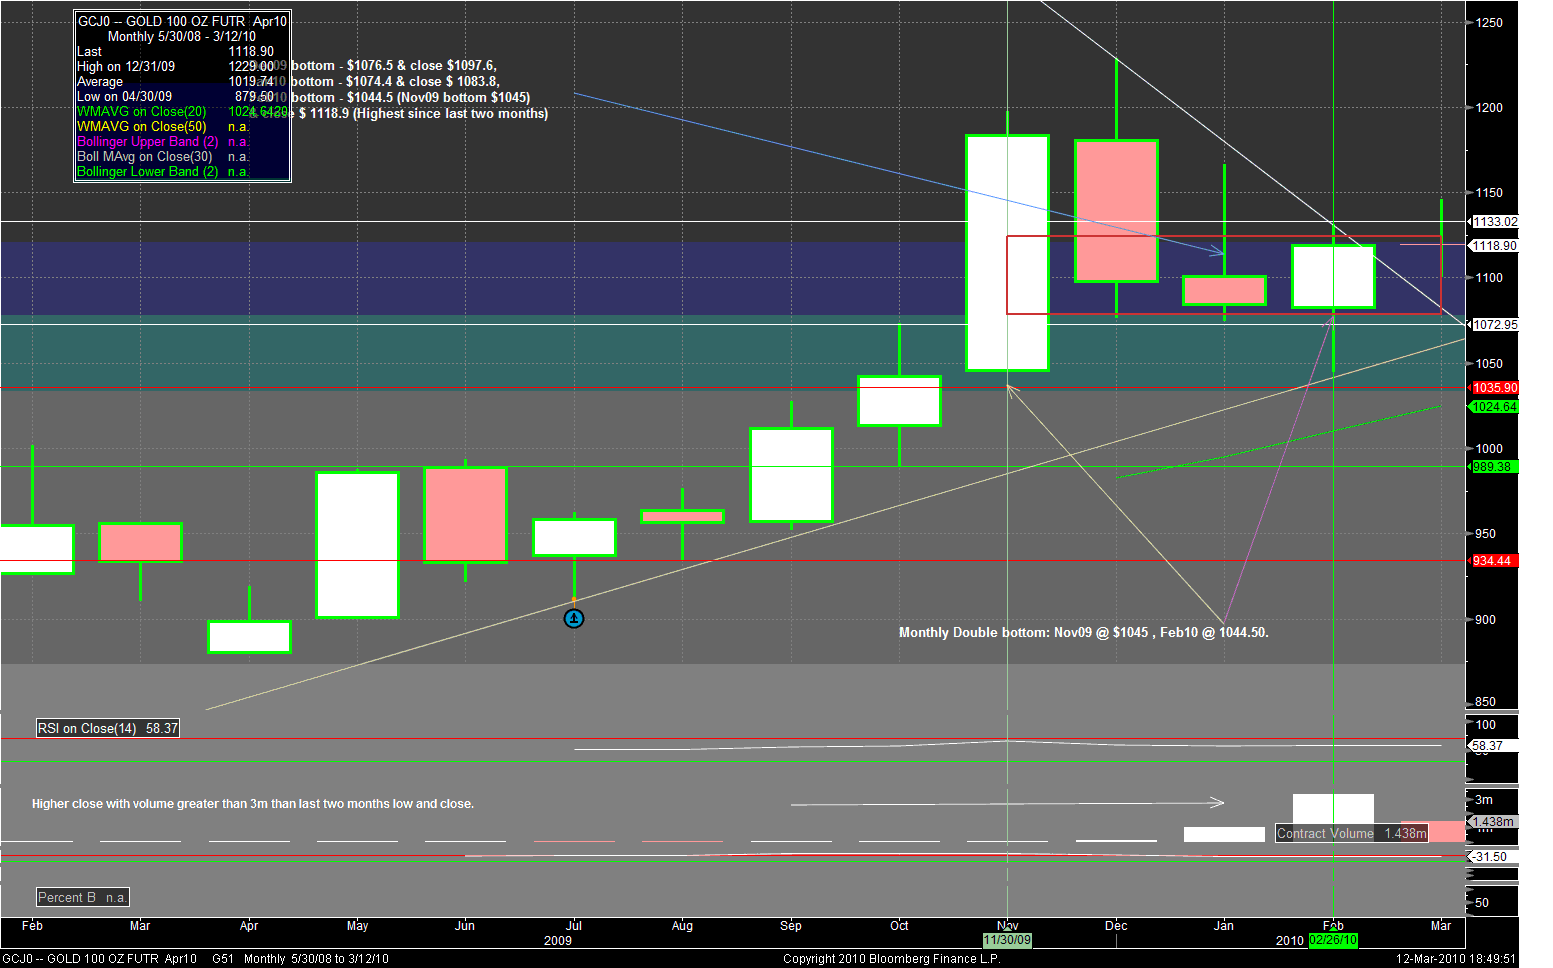
On Monthly chart Gold look strong until it's gives close below $1083 (closing for the month of Jan10), Bull still has an advantage until gold stays above $1118 (closing for the month Feb10) with volume of about 3m+.
Gold Spot Monthly Chart
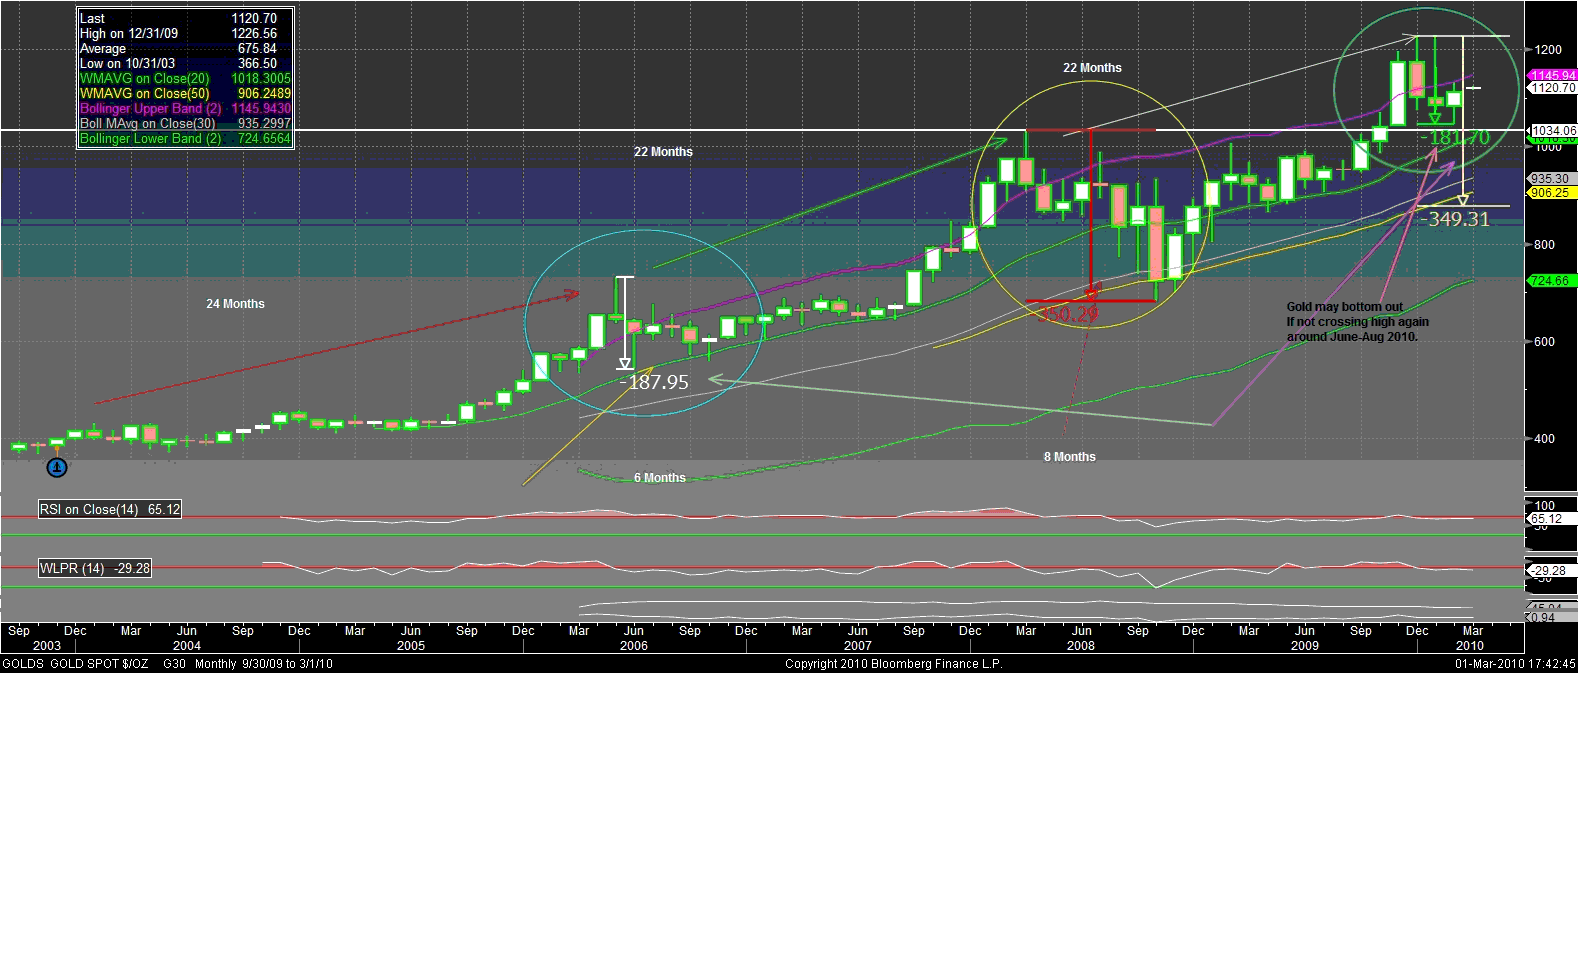
This cyclical Gold chart suggests that gold should make the bottom in next 2-3 months, as per chart gold has 22 to 24 months bull trend cycles after which it has been corrected for 6-8 months in the past. In current scenario gold has corrected about $182 ($1044.5 bottom in Feb 2010) which is equal to 2006 corrections of $187 (6 month). 16 Mar 2010 - Fed Interest rate and policy decision will determine the gold trend, where their gold will extend the correction by $349 (8 months equals to 2008 correction) or the gold has already made the bottom @ $1044.5 (The RBI buying level & Feb 2010 bottom).
Gold History Repeat
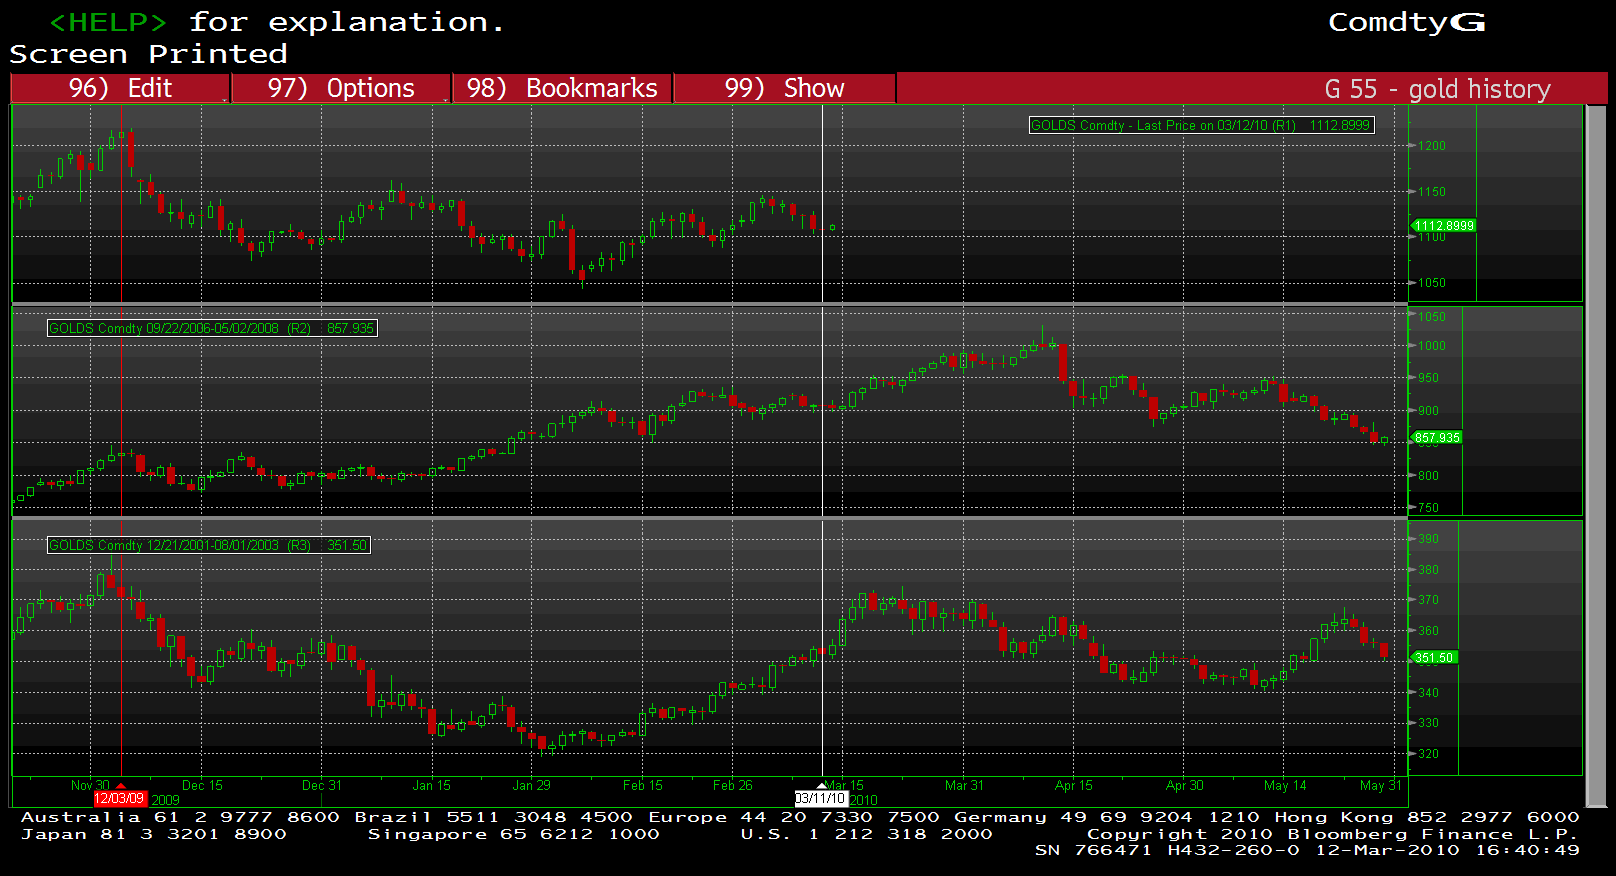
Historical chart comparison shows that if Fed does not come out with stronger policy and fed rate rise (which is not possible at the moment as per last economy data's), gold still has an advantage to spring up from this level until it stays above $1100 level.
--
Thanks,
Commodity Daily
You received this message because you are subscribed to the Google Groups "Commodity Daily" group.
To subscribe visit link http://groups.google.com/group/commoditydaily/subscribe
To unsubscribe from this group, send email to commoditydaily-unsubscribe@googlegroups.com
BLOG : http://commoditydaily.blogspot.com
Note- Members express their own view & may be or may not be having investment or speculative positions in the commodity, please do not take it as buy or sell call, pl use own judgments for buying or selling, after having discussion with your certified investment brokers or the person to whom u have good level of confidence. once sentiment is changed from good to bad no good news work but bad news do work, investors must keep this in mind.
NEW INVESTORS SHOULD BE VERY CAREFUL.
--
Posted By Commodity Daily to Commodity Daily - A World of Possibilities at 3/17/2010 09:30:00 PM
No comments:
Post a Comment