Monday, 31 January 2011

Gold Spot Daily - Triple top 3rd Target achieved @ $1313 - Update 31 Jan 2011

Dear Members,

Please find attached charts for your kind reference.

Happy Trading.
--
Thanks,
Commodity Daily

You received this message because you are subscribed to the Google Groups "Commodity Daily" group.
To subscribe visit link http://groups.google.com/group/commoditydaily/subscribe 
To unsubscribe from this group, send email to commoditydaily-unsubscribe@googlegroups.com

BLOG : http://commoditydaily.blogspot.com

Note- Members express their own view  & may be or may not be having investment or speculative positions in the commodity, please do not take it as buy or sell call, pl use  own judgments for buying or selling, after having discussion with your certified investment brokers or the person to whom u  have good level of confidence. once sentiment is changed from good to bad no good news work but bad news do work, investors must keep this in mind.
NEW INVESTORS SHOULD BE VERY CAREFUL.


--
Posted By Commodity Daily to Commodity Daily - A World of Possibilities at 1/25/2011 01:12:00 PM

Nifty Weekly chart - Target achieved @ 5434 - Update 31 Jan 2011

Dear Members,

Nifty achieved target of 5437, please find attached chart for your reference.

Happy Trading.

Best Regards,
Commodity Daily

You received this message because you are subscribed to the Google Groups "Commodity Daily" group.
To subscribe visit link http://groups.google.com/group/commoditydaily/subscribe 
To unsubscribe from this group, send email to commoditydaily-unsubscribe@googlegroups.com

BLOG : http://commoditydaily.blogspot.com

Note- Members express their own view  & may be or may not be having investment or speculative positions in the commodity, please do not take it as buy or sell call, pl use  own judgments for buying or selling, after having discussion with your certified investment brokers or the person to whom u  have good level of confidence. once sentiment is changed from good to bad no good news work but bad news do work, investors must keep this in mind.
NEW INVESTORS SHOULD BE VERY CAREFUL.

Tuesday, 25 January 2011

Gold Spot triple top first target achieved @ $1337

Dear Members,

Gold spot breakdown of it's triple top formation around $1380, first target achieved today @ $1337.

It is advise to keep profit stop loss as per your risk capacity as US interest rate and GDP data going to be released this week, which may potentially affect the Gold.

Happy Trading.
--
Thanks,
Commodity Daily

You received this message because you are subscribed to the Google Groups "Commodity Daily" group.
To subscribe visit link http://groups.google.com/group/commoditydaily/subscribe 
To unsubscribe from this group, send email to commoditydaily-unsubscribe@googlegroups.com

BLOG : http://commoditydaily.blogspot.com

Note- Members express their own view  & may be or may not be having investment or speculative positions in the commodity, please do not take it as buy or sell call, pl use  own judgments for buying or selling, after having discussion with your certified investment brokers or the person to whom u  have good level of confidence. once sentiment is changed from good to bad no good news work but bad news do work, investors must keep this in mind.
NEW INVESTORS SHOULD BE VERY CAREFUL.

Monday, 17 January 2011

Why Gold Still Has a Long Way to Run

Why Gold Still Has a Long Way to Run

By Rob Marstrand

01/05/11 Buenos Aires, Argentina – The supply of paper currencies is infinite; the supply of gold is finite. This striking contrast provides an excellent reason to exchange the former for the latter.

The gold supply is limited…very limited. According to one estimate, all the above-ground gold in the world totals between 120,000 and 140,000 metric tons. Let's split the difference and call it 130,000 metric tons (about 4.2 billion troy ounces). If you brought it all together and made it into a gigantic cube, it would measure about 19 meters along each side – about three meters short of the length of a tennis court.

Furthermore, about 20% to 25% of all the gold is stored in the world's central banks as country reserves. So the total amount of gold in private hands is enough for just 14 grams for each living person – that's less than half the quantity of a standard one-ounce coin like a US Gold Eagle or a South African Krugerrand.

At present, only about 2.25% of the world's total wealth – or 4.5% of world's financial wealth – is allocated to gold, including jewelry. But resurgent inflation could raise that percentage dramatically, while raising the gold price dramatically in the process.

To gain perspective, let's examine a brief history of the gold price relative to US inflation. The gold price peaked in January 1980 at $850/oz. But this peak was very brief. Gold jumped 29% alone in the run towards $660. Probably a better reference point for the market top is the average price during 1980 as a whole. This was $615/oz. Since then, the gold price has increased only 125%.

Over the same timespan, however, the government's most widely quoted inflation gauge, the Consumer Price Index (CPI), has increased 185%. Therefore, if the gold price had increased as much as the CPI, it would be selling for $1,753/oz today, not $1,390/oz. But the official inflation figures might not be the real story. Using alternative inflation figures calculated by ShadowStats.com, consumer prices have soared an astounding 789% since 1980, which means that the inflation-adjusted gold price would be $5,467/oz.
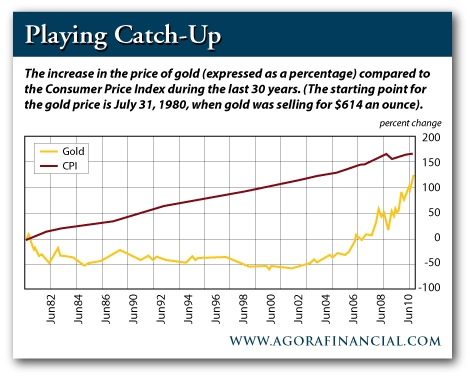
Gold Price vs. CPI Over the Last 30 Years

Interestingly, if we look at the market bottoms for gold – 1970 and 2001 – instead of the market tops, the ShadowStats data seem to provide a much more accurate inflation gauge than the CPI. For example, in January 1970 – before gold's 10-year bull run – the price of gold was just $35/oz. Thirty-one years later – after soaring to more than $800 an ounce in 1980 – the big bear market in gold bottomed out at $256/oz. And the average price for 2001 was $271/oz.

Therefore, during this 31-year period – through gold's full bull and bear market cycle – the gold price advanced 674%. Over the same timeframe, the ShadowStats inflation measure advanced a nearly identical 688%. By contrast, the CPI increased only 370% during this period. In other words, the cumulative CPI readings from 1970 to 2001 failed to account for all the inflation indicated by the rising gold price. The ShadowStats figures, on the other hand, were pretty much bang on target.

I'm staying conservative, and there's nothing to suggest that just because using the ShadowStats inflation worked for the bear market lows it will work for the bull market highs. But if the ShadowStats figures above are a guide, then maybe they point to a price north of $5,000/oz for gold – or even $7,000 for a short time.

I've just thrown a lot of numbers at you. But the point is this: gold looks like it has plenty of upside. But let's be really clear about one thing. I'm not making a hard prediction or setting a price target here. These figures just provide reference points. We also need to watch out for gold "going mainstream" – when references make their way into TV programs, when taxi drivers start talking to you about gold and when your mother calls to ask how to buy an ounce of the stuff.

I can easily see gold getting into the $2,000/oz to $3,000/oz range in the next few years – maybe higher. And there's a very real possibility that we'll have a short-term spike – a genuine investment bubble – that takes us into the $5,000/oz to $8,000/oz.

None of this is certain. And it most likely won't happen smoothly. There could even be big corrections along the way – like between December 1974 and August 1976 when gold fell 47% before powering ahead again. But I hope I've shown you that there are good reasons to think that gold still has plenty of room on the upside.

Conclusion: If you own plenty of gold already, then hang on for the ride. If not, buy more on the dips.

Read more: Why Gold Still Has a Long Way to Run http://dailyreckoning.com/why-gold-still-has-a-long-way-to-run/#ixzz1AoBrLy5X

Thanks,
Commodity Daily

You received this message because you are subscribed to the Google Groups "Commodity Daily" group.
To subscribe visit link http://groups.google.com/group/commoditydaily/subscribe  
To unsubscribe from this group, send email to commoditydaily-unsubscribe@googlegroups.com

BLOG : http://commoditydaily.blogspot.com 

Note- Members express their own view  & may be or may not be having investment or speculative positions in the commodity, please do not take it as buy or sell call, pl use  own judgments for buying or selling, after having discussion with your certified investment brokers or the person to whom u  have good level of confidence. once sentiment is changed from good to bad no good news work but bad news do work, investors must keep this in mind.
NEW INVESTORS SHOULD BE VERY CAREFUL.

--
You received this message because you are subscribed to the Google Groups "Commodity Daily" group.
To post to this group, send email to commoditydaily@googlegroups.com
To subscribe to this group visit link http://groups.google.com/group/commoditydaily/subscribe Non Gmail user can send their email to commoditydaily@gmail.com.
 
To unsubscribe from this group, send email to commoditydaily-unsubscribe@googlegroups.com
 
Note- Members express their own view & may be or may not be having investment or speculative positions in the commodity, please do not take it as buy or sell call, pl use own judgments for buying or selling, after having discussion with your certified investment brokers or the person to whom u have good level of confidence. once sentiment is changed from good to bad no good news work but bad news do work, investors must keep this in mind.
NEW INVESTORS SHOULD BE VERY CAREFUL.

Wednesday, 12 January 2011

Why Gold Still Has a Long Way to Run

Why Gold Still Has a Long Way to Run

01/05/11 Buenos Aires, Argentina – The supply of paper currencies is infinite; the supply of gold is finite. This striking contrast provides an excellent reason to exchange the former for the latter.

The gold supply is limited…very limited. According to one estimate, all the above-ground gold in the world totals between 120,000 and 140,000 metric tons. Let's split the difference and call it 130,000 metric tons (about 4.2 billion troy ounces). If you brought it all together and made it into a gigantic cube, it would measure about 19 meters along each side – about three meters short of the length of a tennis court.

Furthermore, about 20% to 25% of all the gold is stored in the world's central banks as country reserves. So the total amount of gold in private hands is enough for just 14 grams for each living person – that's less than half the quantity of a standard one-ounce coin like a US Gold Eagle or a South African Krugerrand.

At present, only about 2.25% of the world's total wealth – or 4.5% of world's financial wealth – is allocated to gold, including jewelry. But resurgent inflation could raise that percentage dramatically, while raising the gold price dramatically in the process.

To gain perspective, let's examine a brief history of the gold price relative to US inflation. The gold price peaked in January 1980 at $850/oz. But this peak was very brief. Gold jumped 29% alone in the run towards $660. Probably a better reference point for the market top is the average price during 1980 as a whole. This was $615/oz. Since then, the gold price has increased only 125%.

Over the same timespan, however, the government's most widely quoted inflation gauge, the Consumer Price Index (CPI), has increased 185%. Therefore, if the gold price had increased as much as the CPI, it would be selling for $1,753/oz today, not $1,390/oz. But the official inflation figures might not be the real story. Using alternative inflation figures calculated by ShadowStats.com, consumer prices have soared an astounding 789% since 1980, which means that the inflation-adjusted gold price would be $5,467/oz.

Gold Price vs. CPI Over the Last 30 Years

Interestingly, if we look at the market bottoms for gold – 1970 and 2001 – instead of the market tops, the ShadowStats data seem to provide a much more accurate inflation gauge than the CPI. For example, in January 1970 – before gold's 10-year bull run – the price of gold was just $35/oz. Thirty-one years later – after soaring to more than $800 an ounce in 1980 – the big bear market in gold bottomed out at $256/oz. And the average price for 2001 was $271/oz.

Therefore, during this 31-year period – through gold's full bull and bear market cycle – the gold price advanced 674%. Over the same timeframe, the ShadowStats inflation measure advanced a nearly identical 688%. By contrast, the CPI increased only 370% during this period. In other words, the cumulative CPI readings from 1970 to 2001 failed to account for all the inflation indicated by the rising gold price. The ShadowStats figures, on the other hand, were pretty much bang on target.

I'm staying conservative, and there's nothing to suggest that just because using the ShadowStats inflation worked for the bear market lows it will work for the bull market highs. But if the ShadowStats figures above are a guide, then maybe they point to a price north of $5,000/oz for gold – or even $7,000 for a short time.

I've just thrown a lot of numbers at you. But the point is this: gold looks like it has plenty of upside. But let's be really clear about one thing. I'm not making a hard prediction or setting a price target here. These figures just provide reference points. We also need to watch out for gold "going mainstream" – when references make their way into TV programs, when taxi drivers start talking to you about gold and when your mother calls to ask how to buy an ounce of the stuff.

I can easily see gold getting into the $2,000/oz to $3,000/oz range in the next few years – maybe higher. And there's a very real possibility that we'll have a short-term spike – a genuine investment bubble – that takes us into the $5,000/oz to $8,000/oz.

None of this is certain. And it most likely won't happen smoothly. There could even be big corrections along the way – like between December 1974 and August 1976 when gold fell 47% before powering ahead again. But I hope I've shown you that there are good reasons to think that gold still has plenty of room on the upside.

Conclusion: If you own plenty of gold already, then hang on for the ride. If not, buy more on the dips.

Read more: Why Gold Still Has a Long Way to Run http://dailyreckoning.com/why-gold-still-has-a-long-way-to-run/#ixzz1AoBrLy5X

Thanks,
Commodity Daily

You received this message because you are subscribed to the Google Groups "Commodity Daily" group.
To subscribe visit link http://groups.google.com/group/commoditydaily/subscribe  
To unsubscribe from this group, send email to commoditydaily-unsubscribe@googlegroups.com

BLOG : http://commoditydaily.blogspot.com 

Note- Members express their own view  & may be or may not be having investment or speculative positions in the commodity, please do not take it as buy or sell call, pl use  own judgments for buying or selling, after having discussion with your certified investment brokers or the person to whom u  have good level of confidence. once sentiment is changed from good to bad no good news work but bad news do work, investors must keep this in mind.
NEW INVESTORS SHOULD BE VERY CAREFUL.

Friday, 7 January 2011

GLOBAL PIVOTS – MONTHLY – JANUARY 2011

07-01-11 16:45


GLOBAL PIVOTS – MONTHLY – JANUARY 2011.


** P M HIGH = Previous Month High, P M LOW = Previous Month Low, S  = Support  , R = Resistance


COMEX


COMMODITY

P M HIGH

P M LOW

 P M CLOSE

S4

S3

S2

S1

PIOVT

R1

R2

R3

R4

 + / -


GOLD SPOT 

1431.25

1361.39

1420.78

1197.45

1267.31

1337.17

1382.81

1407.03

1452.67

1476.89

1546.75

1616.61

34.76


SILVER SPOT 

30.94

27.97

30.92

21.21

24.18

27.16

29.33

30.13

32.30

33.11

36.08

39.06

2.84


CRUDE JAN 11

92.06

84.20

91.38

66.21

74.07

81.93

87.51

89.79

95.37

97.65

105.51

113.37

6.73


LME


ALUMINIUM 3 M

2488.00

2253.00

2470.00

1716.56

1951.56

2186.56

2355.13

2421.56

2590.13

2656.56

2891.56

3126.56

195.00


COPPER 3 M

9687.00

8338.00

9600.00

5280.50

6629.50

7978.50

8968.00

9327.50

10317.00

10676.50

12025.50

13374.50

1240.00


NICKEL 3 M

25001.00

22850.00

24750.00

17909.75

20060.75

22211.75

23724.50

24362.75

25875.50

26513.75

28664.75

30815.75

1700.00


TIN 3 M

27000.00

24350.00

26900.00

18350.00

21000.00

23650.00

25600.00

26300.00

28250.00

28950.00

31600.00

34250.00

2405.00


ZINC 3 M

2455.00

2110.00

2454.00

1327.25

1672.25

2017.25

2269.50

2362.25

2614.50

2707.25

3052.25

3397.25

342.00


LEAD 3 M

2569.75

2231.00

2550.00

1462.69

1801.44

2140.19

2388.13

2478.94

2726.88

2817.69

3156.44

3495.19

320.00


CURRENCIES


USDINR

45.9000

44.6350

44.7050

41.1788

42.4438

43.7088

44.0475

44.9738

45.3125

46.2388

47.5038

48.7688

-1.1800


USDSGD

1.3228

1.2796

1.2834

1.1631

1.2063

1.2495

1.2625

1.2927

1.3057

1.3359

1.3791

1.4223

-0.0368


EURUSD

1.3499

1.2971

1.3384

1.1720

1.2248

1.2776

1.3109

1.3304

1.3637

1.3832

1.4360

1.4888

0.0401


GBPUSD

1.5911

1.5345

1.5612

1.3891

1.4457

1.5023

1.5268

1.5589

1.5834

1.6155

1.6721

1.7287

0.0050


SGDINR

34.9832

33.9803

34.8341

31.6415

32.6444

33.6473

34.3172

34.6502

35.3201

35.6531

36.6560

37.6589

0.0793


DOLLAR INDEX

81.3600

78.7750

79.0280

71.8530

74.4380

77.0230

77.8560

79.6080

80.4410

82.1930

84.7780

87.3630

-2.1670


USDJPY

84.5100

80.9400

81.1200

71.3675

74.9375

78.5075

79.6450

82.0775

83.2150

85.6475

89.2175

92.7875

-2.5700


ASIAN & AMERICAN MARKETS


BSE

20552.03

19074.57

20509.09

15755.89

17233.35

18710.81

19824.51

20188.27

21301.97

21665.73

23143.19

24620.65

987.84


NSE

6147.30

5721.15

6134.50

4765.48

5191.63

5617.78

5940.55

6043.93

6366.70

6470.08

6896.23

7322.38

271.80


STRAITS TIMES

3220.89

3121.07

3190.04

2895.68

2995.50

3095.32

3169.39

3195.14

3269.21

3294.96

3394.78

3494.60

45.34


HANG SENG

23612.25

22392.67

23035.45

19470.68

20690.26

21909.84

22646.59

23129.42

23866.17

24349.00

25568.58

26788.16

27.46


DOW

11625.00

11007.23

11577.51

9616.85

10234.62

10852.39

11315.32

11470.16

11933.09

12087.93

12705.70

13323.47

571.49


NASDAQ

2675.26

2535.19

2652.87

2220.59

2360.66

2500.73

2606.33

2640.80

2746.40

2780.87

2920.94

3061.01

154.64


NIKKEI 225

10394.22

9918.55

10228.92

8796.46

9272.13

9747.80

10052.72

10223.47

10528.39

10699.14

11174.81

11650.48

291.88


This research report is prepared for general information. This material is not intended as an offer or solicitation for the purchase or sale of any financial instrument.


--
Thanks,
Commodity Daily

You received this message because you are subscribed to the Google Groups "Commodity Daily" group.
To subscribe visit link http://groups.google.com/group/commoditydaily/subscribe 
To unsubscribe from this group, send email to commoditydaily-unsubscribe@googlegroups.com

BLOG : http://commoditydaily.blogspot.com

Note- Members express their own view  & may be or may not be having investment or speculative positions in the commodity, please do not take it as buy or sell call, pl use  own judgments for buying or selling, after having discussion with your certified investment brokers or the person to whom u  have good level of confidence. once sentiment is changed from good to bad no good news work but bad news do work, investors must keep this in mind.
NEW INVESTORS SHOULD BE VERY CAREFUL.